COVID-19 County-Level Vaccination Tracker
A Dash web app to illustrate low overhead web design in Python. Vaccination rates provided by CDC have county FIPS codes usable in a Plotly chloropeth plot. 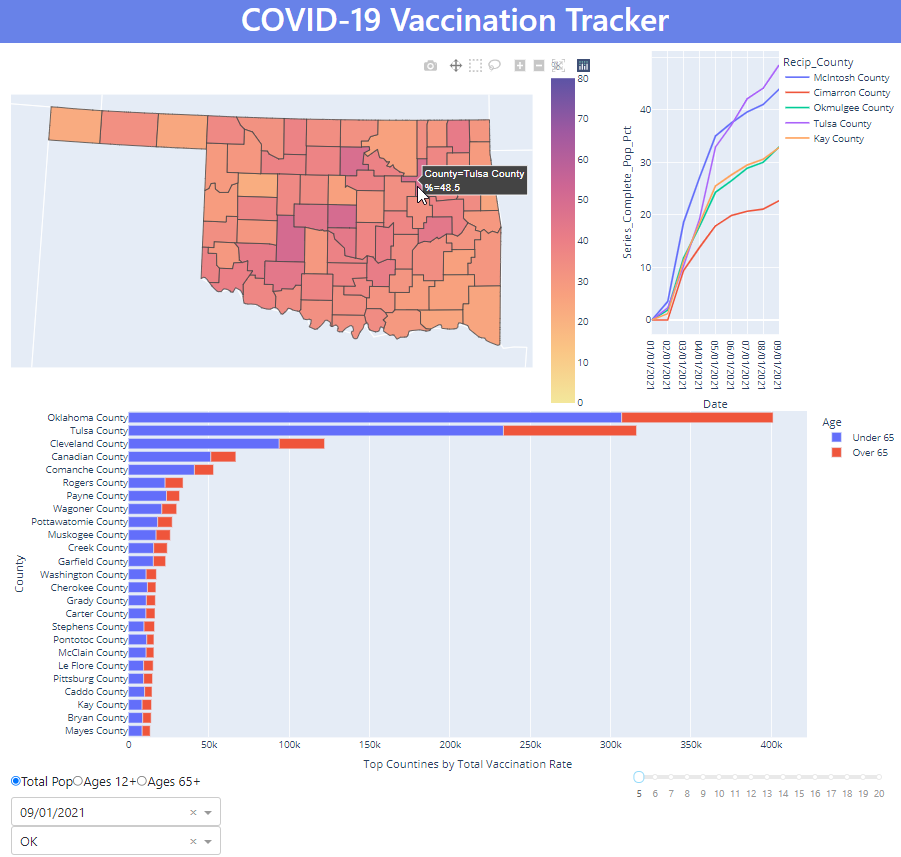

A Dash web app to illustrate low overhead web design in Python. Vaccination rates provided by CDC have county FIPS codes usable in a Plotly chloropeth plot.
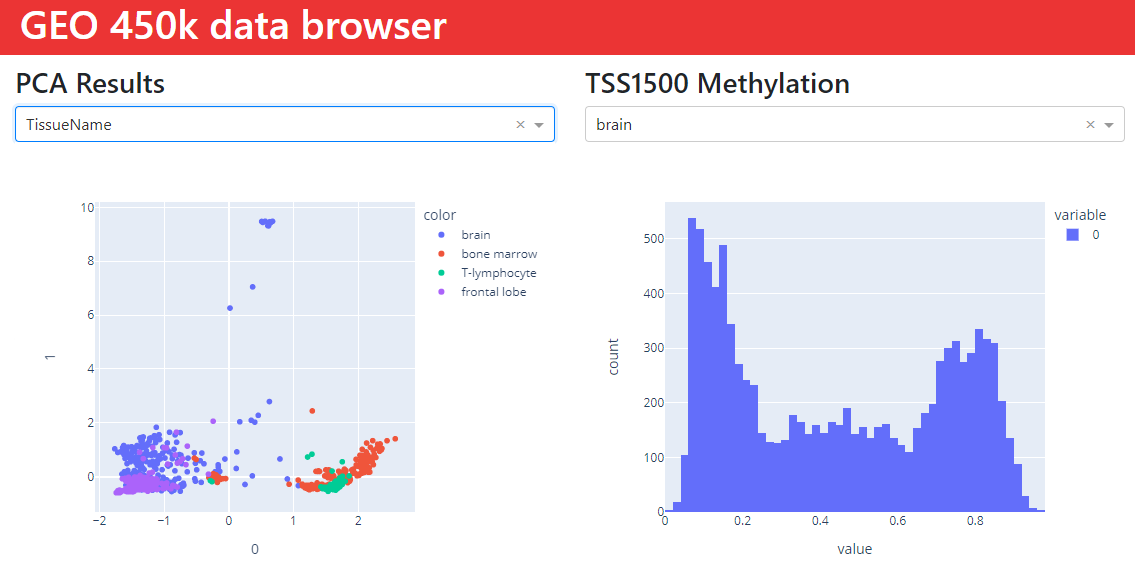
Dash web app part of larger project to automate trend deviation analysis by pull dating from the Gene Expression Omnibus directly. Utilizes GEOparse to pull and parse experiment GSE SOFT files, find columns of interest to combine into a working dataframe. This can then be missing-value imputed and normalized for a variety of downstream analyses, example PCA is shown and colorable by ALE annotations.